Birmingham and the commonwealth games 2022
If you visited Birmingham in 2019, you would've spotted a couple of construction spots here and there. However, if you were to visit the city today, you'll find construction sites everywhere, and there's a reason behind it: The 2022 Commonwealth Games. Birmingham is scheduled to host the Common wealth games between the 28th of July 2022 and the 8th of August2022. However, Birmingham is considered a second-class city. The city council has been working to change that by improving the infrastructure and remodelling some old buildings.
These changes would have multiple effects on a city's dynamics, and Birmingham is no different. Therefore, today's analysis will investigate the various sub types of residential properties and how each has performed between April 2020 and Jan 2022. More specifically, we will look at the prices and rents of residential properties regarding the number of bedrooms.
A macro POV
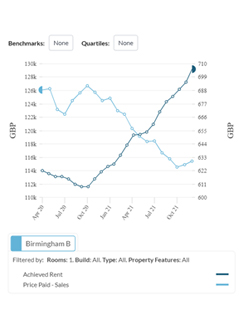
From a macro point of view, Birmingham's residential properties rose by 11.4% in value from April 2020 to Jan. 2022, giving investors almost £20,000 in equity gains on average. On the surface, it looks like this is a good number. However, if we look at a closer date range, we can notice that if you invested in June 2021, you would've lost around 4% of your principal, from 220K in June 2021 to an average of 215K in Jan. 2022. Even more, the Realyse data shows that investors have lost 10.5% of their initial investment as of the current month of writing. There could be many reasons behind this short-term drop, such as supply increase or decreasing demand for a particular asset type.
Equity is not the only thing that investors look at. Another metric that we will consider in this paper is achieved rents. Over the period ranging from April 2020 to January 2022, rents rose from £741 to£815. If we compare this 10.8% increase in rents to the 5.5% increase in the consumer prices index (CPI) in 2021, the rents increase is almost double the inflation rate.
Another interesting fact is the divergence between rents and prices that happened on Oct. 2021. While prices decreased, rents increased dramatically. To understand this phenomenon better, let's dive deeper into how each sub type performed, starting with studios.